Phase 2 · Measure
How to set the KPIs of an improvement project
A project KPI says where the process starts, where it should end up and by when. With a measured baseline, interim milestones and a trend, you know whether the project is on course long before the deadline.
In short
An improvement-project KPI is a measurable indicator with a baseline measured before any change, a dated target, interim milestones in between and regular measurements plotted as a trend, so the team can tell whether the project is on track before the deadline.
What it is
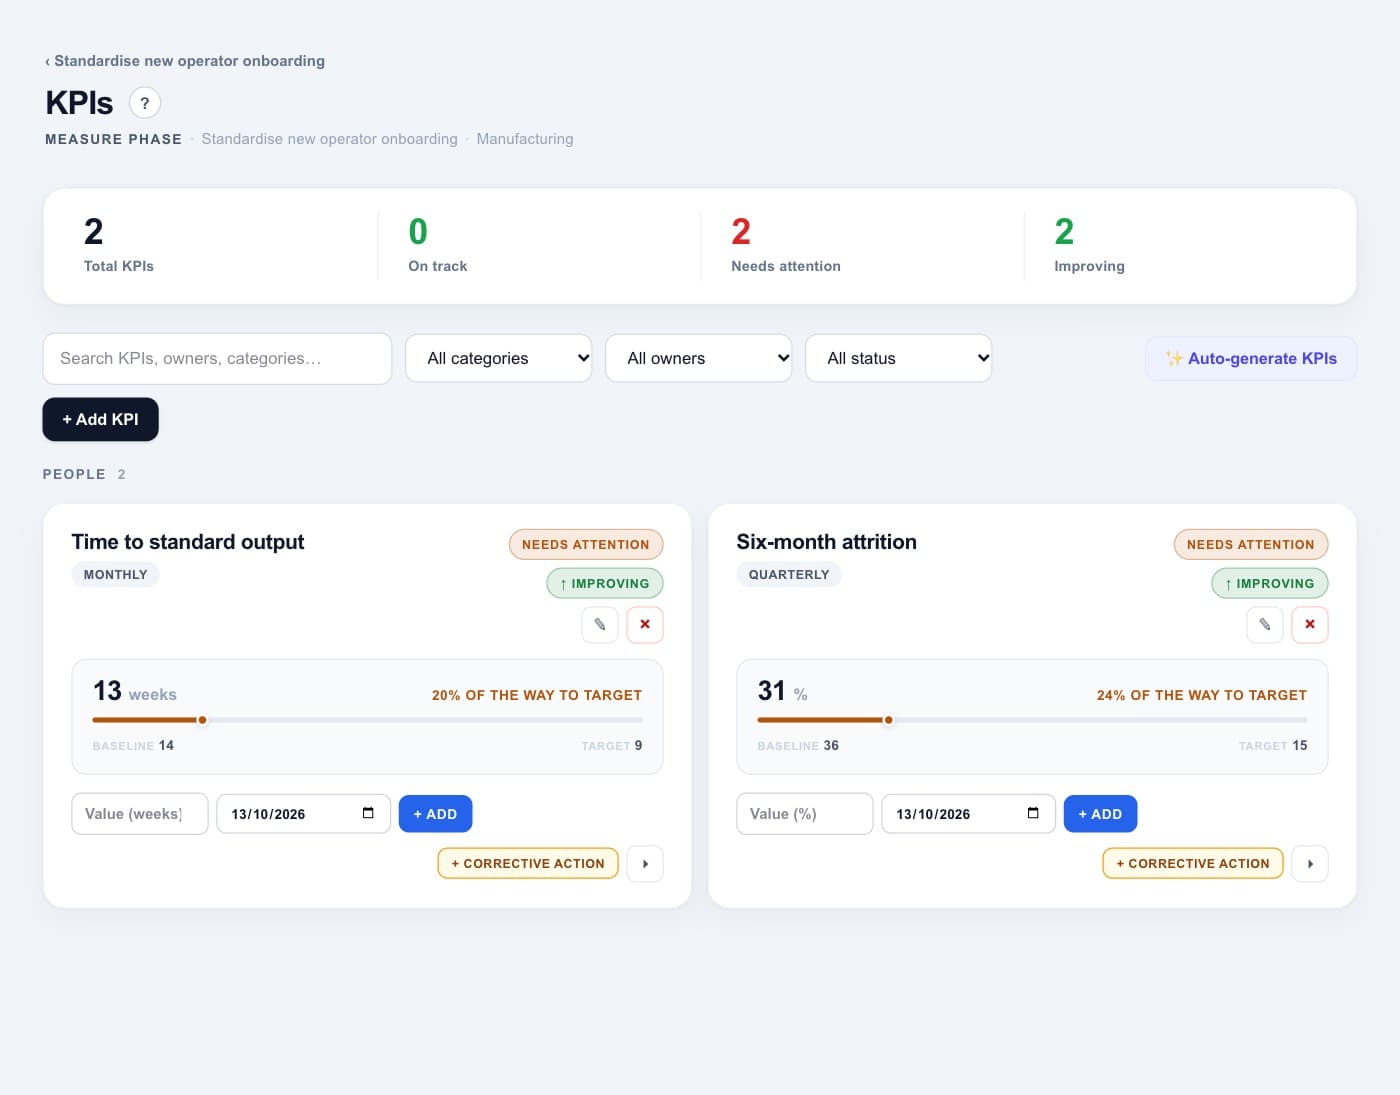
The baseline is the value measured before the project changes anything. It is never touched again, because the improvement is proven against it. The target says where you want to be and by when, the milestones split the distance into checkpoints, and the trend shows each measurement against them.
A project needs few KPIs: one or two that measure the goal in the charter, and often a leading indicator that moves sooner, so you do not have to wait months to see whether the changes are working.
When to use it
- In the Measure phase, once the problem is scoped and before analysing causes.
- When the charter’s goal has to become figures the team can follow week by week.
- When a project runs for months and the sponsor needs to see progress before the end.
How to do it, step by step
- 1Define each KPI precisely. What is counted, from where to where, and how. “Weeks from first day to standard output, per operator” leaves no room for interpretation.
- 2Measure the baseline before changing anything. Use real past data, and write down the period and the source. An estimated baseline cannot prove an improvement.
- 3Set the target and the direction. Where you want to get to and by when, taken from the charter. Note whether lower or higher is better.
- 4Place interim milestones. Two or three checkpoints between baseline and target, timed to when each change is expected to take effect.
- 5Measure at a fixed rhythm and plot the trend. Weekly or monthly, always in the same way. One point says little; the trend against the milestones says whether you are on course.
Worked example
Case: a plant that wants new operators to reach standard output sooner.
| KPI | Baseline | Milestones | Target |
|---|---|---|---|
| Weeks to standard output (lower is better), measured weekly | 14 weeks (last 11 new operators) | 12 by 31 July · 10.5 by 31 August | 9 by 30 September |
| Six-month attrition of new operators (lower is better), measured monthly | 36% (4 of the last 11) | 28% by 31 July · 20% by 31 August | 15% by 30 September |
| New operators with a weekly progress review (leading indicator) | 0% | 50% by 30 June · 100% by 31 July | 100%, every week |
Common mistakes
- Setting the baseline after the changes have started, so part of the improvement is lost or invented.
- A target with no date and no milestones, so nobody knows the project is late until the end.
- Changing how the KPI is measured halfway through, which breaks the trend.
- Following only a lagging result such as attrition, which takes months to move.
Frequently asked questions
What is a KPI baseline?
The value of the indicator measured before the project changes anything. It stays fixed and is the reference against which the improvement is proven.
What is the difference between a leading and a lagging indicator?
A lagging indicator measures the result once it has happened, such as six-month attrition. A leading indicator moves earlier and anticipates it, such as the share of new operators reviewed every week.
How many KPIs should an improvement project have?
Few: one or two that measure the goal, plus, where useful, a leading indicator and one to watch for side effects. Beyond that, attention spreads too thin.