Phase 3 · Analyse
The Ishikawa diagram: how to build one, step by step
The Ishikawa, or fishbone, diagram sorts every possible cause of a problem into categories. It stops the team from settling for the first explanation that comes up in the meeting.
In short
An Ishikawa diagram, also called a fishbone or cause-and-effect diagram, groups the possible causes of a problem into categories such as method, manpower, machine, material, measurement and environment, so the team explores them in order before choosing which ones to verify.
What it is
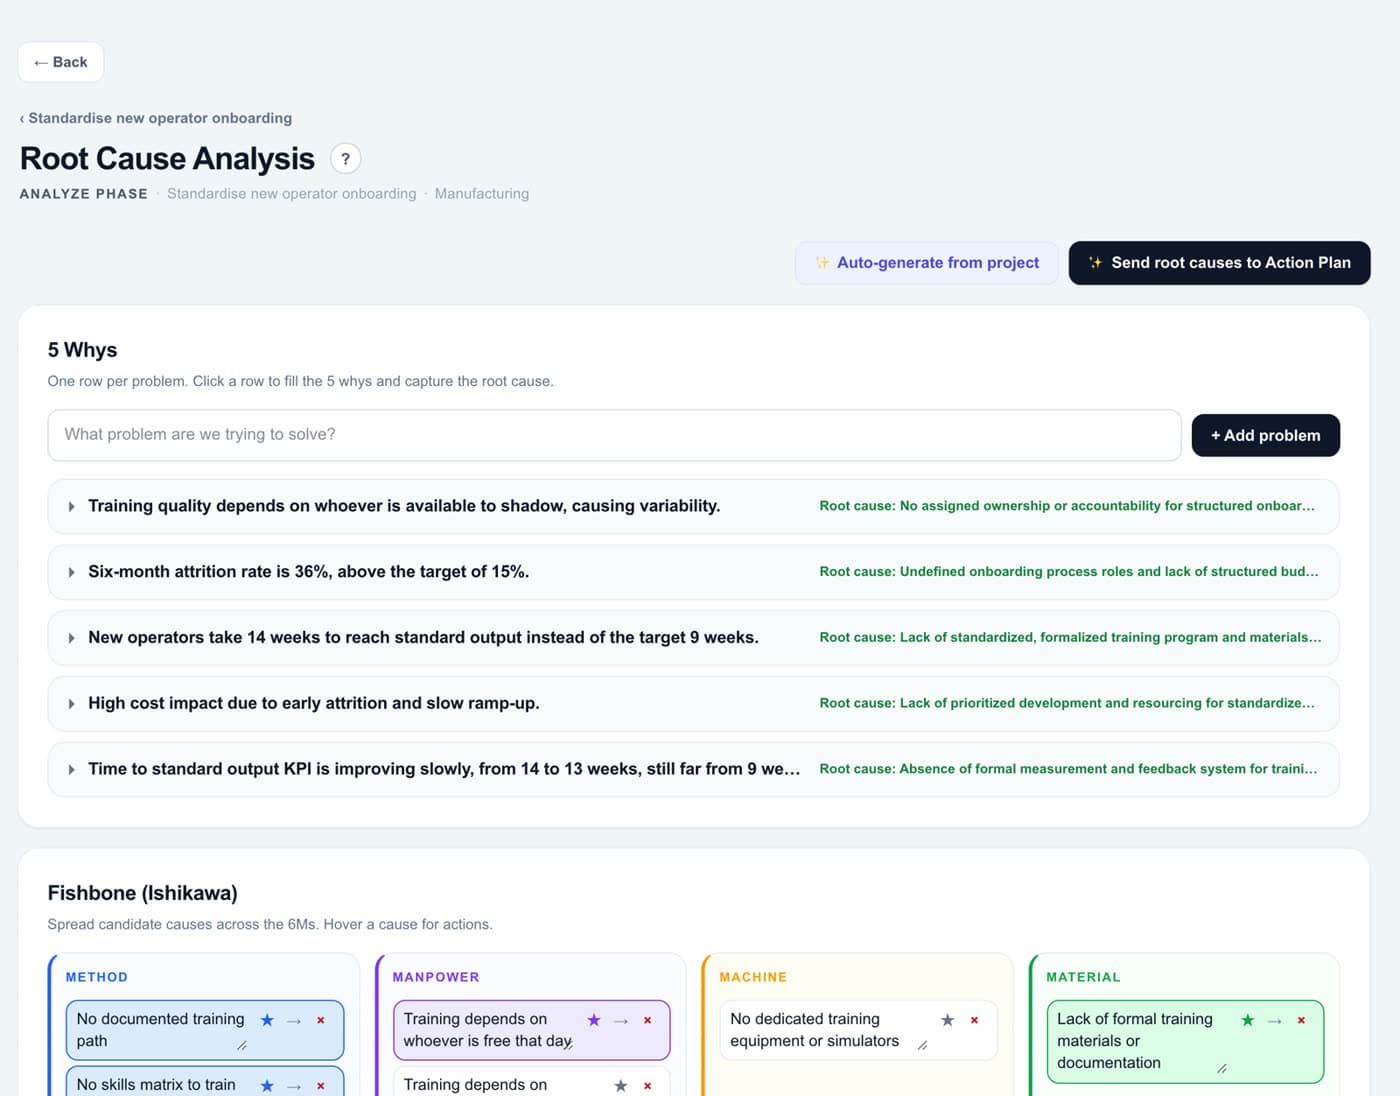
It is drawn as a fishbone: the problem goes in the head and the causes are grouped on bones by category. The most common categories are the 6Ms: method, manpower, machine, material, measurement and environment.
On its own it proves nothing: it produces hypotheses. The most likely causes are then checked with data or with the 5 Whys.
When to use it
- In the Analyze phase, once the problem is measured and scoped.
- When the team has many different explanations that need sorting.
- Before proposing solutions, so you do not attack a symptom.
How to do it, step by step
- 1Write the problem in the head. Specific and measurable: “A new operator takes 14 weeks to reach standard output”, not “training is going badly”.
- 2Draw the 6M bones. Method, manpower, machine, material, measurement and environment. If one does not apply, leave it empty.
- 3Add every possible cause. Brainstorm with the team, without debating yet. Each cause on its bone.
- 4Ask why on each cause. Go one level down on the important causes so you do not stay on the surface.
- 5Mark the most likely ones and check them. Pick two or three and verify them with data before acting.
Worked example
Case: a plant that wants new operators to reach standard output sooner.
🐟 A new operator takes 14 weeks to reach standard output (target: 9).
Method
- No documented training path
- Training by imitation, with no order
Manpower
- Training depends on whoever is free that day
- Trainers have no time set aside
Machine
- Practice stations taken up by production
Material
- Out-of-date work instructions
Measurement
- Each operator’s progress is not measured
Environment
- Shifts change, and so does the buddy
Common mistakes
- Writing solutions instead of causes (“we need a manual” instead of “instructions are unclear”).
- Accepting the first cause without checking it with data.
- A vague problem in the head, which leads to equally vague causes.
- Filling in the diagram without the people who know the process.
Frequently asked questions
What are the 6M of the Ishikawa diagram?
Method, Manpower, Machine, Material, Measurement and Mother Nature (environment). They are a starting point; use the categories that fit your process.
What is the difference between Ishikawa and the 5 Whys?
Ishikawa widens the search to every possible cause; the 5 Whys goes deep into one chain of causes. They are often used together: Ishikawa first, then the 5 Whys on the likeliest causes.
When do you stop adding causes?
When the team runs out of ideas. Then choose the likeliest causes and check them with data before acting.